Back to top
more

PennyMac Mortgage Investment Trust (PMT)

(Real Time Quote from BATS)

$9.56 USD

9.56
413,136

+0.13 (1.38%)

Updated Aug 19, 2026 02:32 PM ET

Zacks Rank:

This is our short term rating system that serves as a timeliness indicator for stocks over the next 1 to 3 months. How good is it? See rankings and related performance below.

Zacks Rank Definition Annualized Return
1Strong Buy23.94%
2Buy18.22%
3Hold10.27%
4Sell5.79%
5Strong Sell3.20%
S&P50011.55%

Zacks Rank Education - Learn about the Zacks Rank

Zacks Rank Home - Zacks Rank resources in one place

Zacks Premium - The only way to fully access the Zacks Rank

5-Strong Sell of 5         5

Style Scores:

The Style Scores are a complementary set of indicators to use alongside the Zacks Rank. It allows the user to better focus on the stocks that are the best fit for his or her personal trading style.

The scores are based on the trading styles of Value, Growth, and Momentum. There's also a VGM Score ('V' for Value, 'G' for Growth and 'M' for Momentum), which combines the weighted average of the individual style scores into one score.

  • Value Score A
  • Growth Score A
  • Momentum Score A
  • VGM Score A

Within each Score, stocks are graded into five groups: A, B, C, D and F. As you might remember from your school days, an A, is better than a B; a B is better than a C; a C is better than a D; and a D is better than an F.

As an investor, you want to buy stocks with the highest probability of success. That means you want to buy stocks with a Zacks Rank #1 or #2, Strong Buy or Buy, which also has a Score of an A or a B in your personal trading style.

Zacks Style Scores Education - Learn more about the Zacks Style Scores

F Value F Growth F Momentum F VGM

Industry Rank:

The Zacks Industry Rank assigns a rating to each of the 265 X (Expanded) Industries based on their average Zacks Rank.

An industry with a larger percentage of Zacks Rank #1's and #2's will have a better average Zacks Rank than one with a larger percentage of Zacks Rank #4's and #5's.

The industry with the best average Zacks Rank would be considered the top industry (1 out of 265), which would place it in the top 1% of Zacks Ranked Industries. The industry with the worst average Zacks Rank (265 out of 265) would place in the bottom 1%.

Zacks Rank Education -- Learn more about the Zacks Rank
Zacks Industry Rank Education -- Learn more about the Zacks Industry Rank

Bottom 9% (226 out of 247)

Industry: REIT and Equity Trust

Price, Consensus & Surprise


Quote Overview

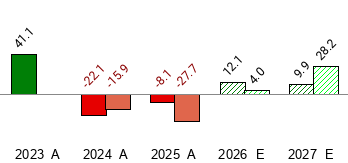
Sales and EPS Growth Rates (Y/Y %)

Industry analysis module loader

Zacks Rank Factors

Upside Most Accurate Estimate vs. Zacks Consensus

The Zacks Rank is comprised of four factors: Agreement, Magnitude, Upside and Surprise.

Upside is the percentage difference between the most accurate estimate and the consensus estimate.

By dividing the most accurate estimate (as calculated by Zacks) by the consensus estimate, you can see the difference between the two. A positive difference is obviously better than a negative one.

We've quantified the difference between the two estimates with our Earnings ESP (Expected Surprise Prediction). Simply put, stocks with a Zacks Rank of 1, 2, or 3, with a positive ESP were shown to positively surprise 70% of the time.

Factor #3: Upside - Learn more


Q1

Q2

F1

F2
Most Acc. Est.NANANANA
Zacks Cons. EstNANANANA
DifferenceNANANANA
Earnings ESP %: no-arrowno-arrowno-arrowno-arrow
NA NA NA NA

Surprise EPS Surprise (last 4 quarters)

The Zacks Rank is comprised of four factors: Agreement, Magnitude, Upside and Surprise.

The Surprise factor looks at the last few quarters of earnings surprises.

Companies with a positive earnings surprise are more likely to positively surprise in the future (or miss again if they recently missed).

For this reason, looking at a company's recent surprise history can be a great aid in forecasting the surprise likelihood of their next outing.

Factor #4: Surprise - Learn more


Regarding the arrows in the accompanying display, please see the legend below.

Positive Surprise Negative Surprise Magnitude
0% (as expected)
Surprise between zero and 10 Surprise between zero and -10 Up to 10%
Surprise between 10 and 20 Surprise between -10 and -20 10-20%
Surprise between 20 and 30 Surprise between -20 and -30 20-30%
Surprise between 30 and 40 Surprise between -30 and -40 30-40%
Surprise between 40 and 50 Surprise between -40 and -50 40-50%
Surprise greater than 50 Surprise less than -50 Greater than 50%
Q0
(NA)
Q-1
(NA)
Q-2
(NA)
Q-3
(NA)
ReportedNANANANA
EstimateNANANANA
DifferenceNANANANA
EPS Surprise %:
NANANANA

News for PMT

Trending topics module loader
Industry analysis module loader

Company Summary

Read MoreRead Less
Company description module loader